The deployment of large language models (LLMs) into live production environments marks the beginning of an ongoing technical challenge rather than the culmination of a machine learning project. As real-world users interact with these systems, their behaviors, phrasing, and underlying intent inevitably evolve. Because modern LLMs process information by converting raw text into high-dimensional numerical vectors known as embeddings, this behavioral shift manifests directly within the vector space. When the statistical properties of these incoming embeddings diverge significantly from the baseline training or reference data, a phenomenon known as embedding drift occurs. Failing to detect and mitigate this drift can lead to degraded model performance, irrelevant retrieval-augmented generation (RAG) results, and ultimately, frustrated end users.
Traditional data drift detection methods, which were historically designed for low-dimensional tabular data, routinely fail when applied to high-dimensional embeddings. Standard statistical tests struggle with the curse of dimensionality, necessitating specialized approaches tailored to vector representations. Industry practitioners and machine learning engineers have increasingly turned to advanced methodologies—such as domain classifiers and centroid distance measurements—to safeguard production systems. By integrating these detection techniques with open-source frameworks like Scikit-LLM and sentence-transformers, organizations can establish automated monitoring pipelines that flag behavioral shifts before they impact core business applications.
Understanding the Mechanics of Embedding Drift
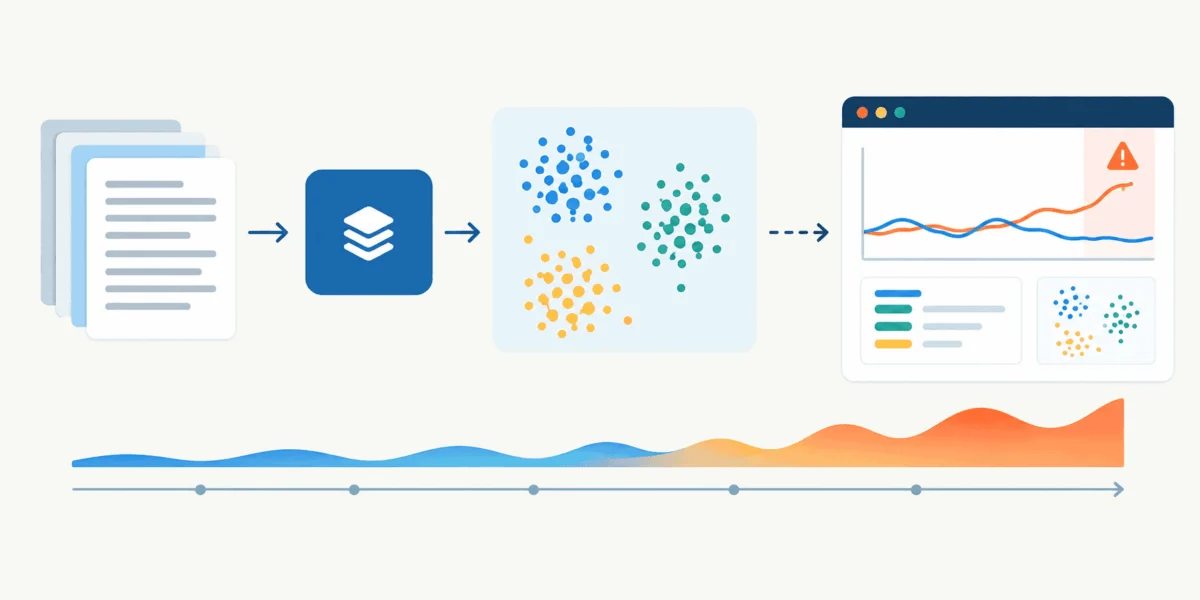
To appreciate the necessity of robust drift monitoring, one must first examine how data travels through a modern LLM application. When a user submits a query, it passes through an embedding model—often a transformer-based architecture mapping semantic meaning to hundreds of continuous dimensions (frequently 384, 768, or 1536 dimensions). These vectors are subsequently stored in vector databases, utilized for semantic search, or fed directly into downstream classification and generation pipelines.
Over weeks and months, external events, seasonal trends, or product updates alter the nature of user inputs. For instance, a customer support chatbot originally optimized for simple account retrieval tasks ("How do I reset my password?") may suddenly experience a surge of inquiries regarding newly introduced decentralized finance features ("How to mint an NFT on the platform?"). While the LLM itself may still generate a coherent response, the semantic coordinates of these queries occupy an entirely different region of the vector space. If the system’s underlying vector index or classification boundaries were tuned strictly to the original baseline, performance degrades quietly.
This silent degradation underscores why reactive troubleshooting is insufficient. Engineering teams require proactive detection frameworks that can evaluate batches of production data against reference baselines continuously.
Techniques for Effective Embedding Drift Detection in Production
Monitoring high-dimensional vectors requires a delicate balance between computational efficiency and statistical rigor. Industry deployments generally rely on three prominent paradigms: domain classification, centroid distance tracking, and density-based distance metrics.
The domain classifier approach reframes unsupervised drift detection as a supervised binary classification problem. Engineers take a sample of the reference dataset (labeled as class 0) and a sample of incoming production data (labeled as class 1), combining them into a single evaluation set. A lightweight machine learning model—typically a Random Forest or logistic regression classifier—is then trained to distinguish between the two distributions. If the classifier achieves high predictive performance, measured via metrics like ROC-AUC well above the random-guess threshold of 0.5, it proves that the production data has fundamentally diverged from the baseline.
Alternatively, the centroid distance method—frequently referred to as the "center of mass" approach—offers a computationally lightweight alternative. By calculating the mean vector (centroid) of the reference batch and comparing it to the mean vector of the production batch using metrics such as cosine distance, systems can monitor directional shifts in the embedding space. While this method sacrifices some nuance by collapsing complex, multi-modal distributions down to a single central point, it provides a fast and interpretable mechanism for continuous system health checks.
Simulating and Implementing Drift Detection in Python
To operationalize these concepts, developers can implement simulation pipelines using standard data science libraries. By generating synthetic embeddings that mimic the 384-dimensional output of standard sentence-transformers, engineers can model the exact mathematical conditions under which drift occurs.
Consider a scenario where an initial baseline dataset, $Xreference$, is generated from a normal distribution centered at zero. To simulate a sudden shift in user intent or topic emergence, a production dataset, $Xproduction$, is generated with a shifted mean. Using a random forest domain classifier, the system attempts to separate these two batches.
import numpy as np
from sklearn.ensemble import RandomForestClassifier
from sklearn.model_selection import train_test_split
from sklearn.metrics import roc_auc_score

# Simulating 384-dimensional embeddings (e.g. standard sentence-transformers output)
n_samples = 500
n_features = 384

# 1. Reference Embeddings (Baseline / Training Data)
np.random.seed(42)
X_reference = np.random.normal(loc=0.0, scale=1.0, size=(n_samples, n_features))

# 2. Production Embeddings (New Data) with a shifted mean
X_production = np.random.normal(loc=0.3, scale=1.0, size=(n_samples, n_features))

# Assigning labels: 0 for reference, 1 for production
y_reference = np.zeros(n_samples)
y_production = np.ones(n_samples)

# Combining datasets
X_combined = np.vstack((X_reference, X_production))
y_combined = np.hstack((y_reference, y_production))

# Splitting data for the drift detector
X_train, X_test, y_train, y_test = train_test_split(
    X_combined, y_combined, test_size=0.3, random_state=42
)

# Training a lightweight Random Forest classifier
drift_classifier = RandomForestClassifier(n_estimators=50, max_depth=5, random_state=42)
drift_classifier.fit(X_train, y_train)

# Evaluating the classifier using ROC-AUC
y_pred_proba = drift_classifier.predict_proba(X_test)[:, 1]
roc_auc = roc_auc_score(y_test, y_pred_proba)

print(f"Domain Classifier ROC-AUC Score: roc_auc:.3f")

if roc_auc > 0.65:
    print("ALERT: Significant embedding drift detected! Trigger retraining/review pipeline.")
else:
    print("System stable: Distributions are sufficiently similar.")
When executed, this simulation typically yields a high ROC-AUC score (e.g., 0.970), immediately triggering the alert logic. This confirms that even subtle shifts in underlying statistical parameters are readily detectable via classification boundaries.
Applying Centroid Calculations to Vector Spaces
For environments requiring minimal latency overhead, the centroid distance approach provides an immediate health indicator. By computing the cosine distance between the mean vector of the reference baseline and the production batch, teams can establish definitive alerting thresholds.
from sklearn.metrics.pairwise import cosine_distances

# 1. Calculating the centroid (mean vector) for both batches
centroid_ref = np.mean(X_reference, axis=0).reshape(1, -1)
centroid_prod = np.mean(X_production, axis=0).reshape(1, -1)

# 2. Calculating the cosine distance between the two centroids
distance = cosine_distances(centroid_ref, centroid_prod)[0][0]
print(f"Centroid Cosine Distance: distance:.4f")

# 3. Alerting Logic
threshold = 0.05
if distance > threshold:
    print("ALERT: Centroid distance exceeded threshold! System drifting.")
else:
    print("System stable: Centroids are aligned.")
While highly efficient, practitioners must calibrate the threshold parameter carefully. Baseline variance differs significantly across application domains, meaning a threshold that works for financial text models may trigger false positives in creative writing applications.
Real-World Implementation with Scikit-LLM and Sentence Transformers
Moving beyond simulated environments, real-world applications leverage specialized libraries like Scikit-LLM and sentence-transformers to process actual textual inputs. This setup allows engineering teams to evaluate queries derived from live user traffic against static historical logs.
Suppose a customer service application transitions from handling routine platform navigation questions to processing inquiries concerning complex financial instruments or emerging technologies. By passing these distinct text corpora through a lightweight embedding model such as all-MiniLM-L6-v2, developers can execute end-to-end drift detection on real semantic content.
from sentence_transformers import SentenceTransformer
from skllm.config import SKLLMConfig

# Initializing vectorizer for text-to-embedding generation
vectorizer = SentenceTransformer('all-MiniLM-L6-v2')

# Defining baseline raw texts and production texts with a drastic topic shift
texts_reference = [
    "How do I reset my password?",
    "Where is the billing menu?"
] * 100

texts_production = [
    "The new cryptocurrency system is failing",
    "How to mint an NFT on the platform?"
] * 100

# Converting text to high-dimensional embeddings
X_reference = vectorizer.encode(texts_reference)
X_production = vectorizer.encode(texts_production)

# Re-applying classification drift detection
y_reference = np.zeros(len(X_reference))
y_production = np.ones(len(X_production))

X_combined = np.vstack((X_reference, X_production))
y_combined = np.hstack((y_reference, y_production))

X_train, X_test, y_train, y_test = train_test_split(
    X_combined, y_combined, test_size=0.3, random_state=42
)

clf = RandomForestClassifier(n_estimators=50, max_depth=5).fit(X_train, y_train)
roc_auc = roc_auc_score(y_test, clf.predict_proba(X_test)[:, 1])

print(f"ROC-AUC Score: roc_auc:.3f")
if roc_auc > 0.65:
    print("DRIFT DETECTED! User queries have changed topic.")
else:
    print("System stable: Embeddings are consistent.")
When executed on genuinely divergent text corpora, the domain classifier achieves an ROC-AUC score of 1.000, confirming that the semantic shift is absolute and unmistakable. Similarly, running the centroid distance calculation on these real-world sentence embeddings produces a substantial distance score, validating the effectiveness of geometric monitoring in production pipelines.
Implications and Future Outlook for MLOps
The integration of embedding drift detection into standard MLOps workflows represents a maturing of the generative artificial intelligence industry. In the early phases of the LLM boom, organizations focused primarily on model capability, prompt engineering, and initial deployment success. However, as applications scale to serve millions of enterprise and consumer users, maintenance, reliability, and observability have taken center stage.
Unchecked embedding drift has cascading operational consequences. In retrieval-augmented generation systems, drifting user queries fail to retrieve relevant chunks from vector databases, resulting in hallucinated or inaccurate model outputs. In classification and routing pipelines, drift causes miscategorizations that degrade automated workflows. By establishing automated monitoring routines that combine domain classifiers with fast geometric distance checks, engineering teams can transition from reactive firefighting to predictive maintenance.
Ultimately, monitoring embedding drift ensures that deployed large language models remain aligned with the realities of their user base. As tooling continues to evolve within the open-source ecosystem, proactive drift detection will become a mandatory standard for any enterprise deploying mission-critical AI infrastructure.