
The evaluation of knife steel has long been a complex endeavor for enthusiasts, manufacturers, and custom bladesmiths, often relying on anecdotal evidence or marketing claims from steel producers. However, recent advancements in metallurgical research and standardized testing have paved the way for a more scientific approach to predicting performance. By analyzing the chemical composition of a steel—specifically its carbon, chromium, and vanadium content—alongside its manufacturing process, it is now possible to estimate key performance metrics such as edge retention, toughness, and corrosion resistance with a high degree of accuracy. This analytical framework seeks to demystify the relationship between chemistry and performance, providing a toolkit for predicting how a blade will behave in the field before it ever touches a sharpening stone.
The Evolution of Material Transparency in the Knife Industry
Historically, the knife industry operated with a significant data gap. Steel manufacturers like Crucible Industries, Carpenter Technology, and Bohler-Uddeholm provided technical data sheets for their products, but these documents were often optimized for industrial tooling applications rather than the specific needs of cutlery. Furthermore, comparative data between competing brands was virtually non-existent. A manufacturer might compare its own high-speed steels against its own cold-work tool steels, but they rarely provided head-to-head comparisons against a rival’s equivalent grade.
This lack of third-party verification led to the rise of independent metallurgical testing. Over the last decade, researchers have utilized standardized methods such as the CATRA (Cutlery and Allied Trades Research Association) edge retention test and the Charpy C-notch impact test to build a comprehensive database of steel performance. These experiments have revealed that while there are occasional outliers, the vast majority of steel properties are highly predictable based on fundamental metallurgical principles. The current shift toward data-driven selection allows consumers to bypass "super steel" hype and understand the actual mechanical trade-offs inherent in any given alloy.
Predicting Edge Retention Through Carbide Chemistry
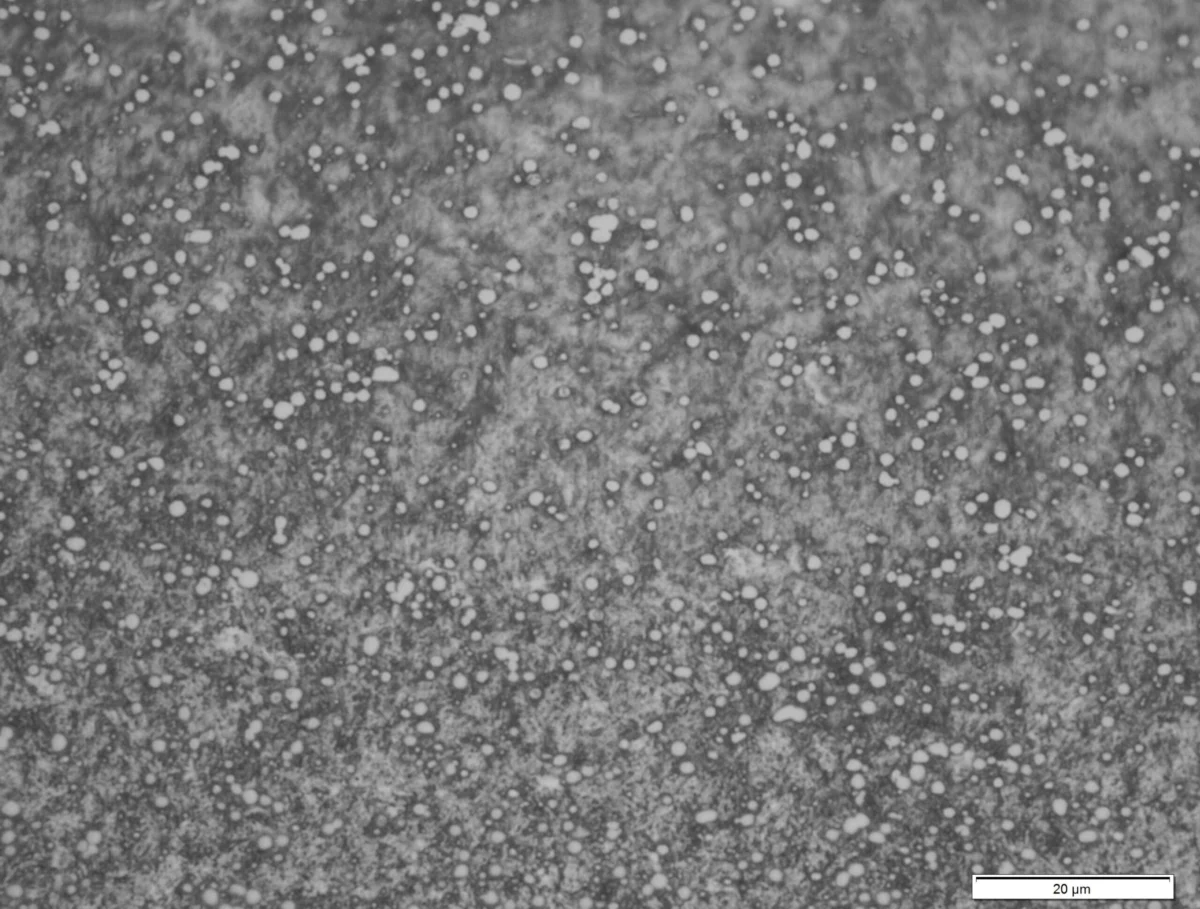
Edge retention is arguably the most scrutinized property in the knife community. It is primarily a function of two factors: the hardness of the steel matrix and the volume and type of carbides present in the microstructure. Carbides are hard particles that form when carbon reacts with alloying elements like chromium, vanadium, tungsten, or molybdenum during the steel-making process.
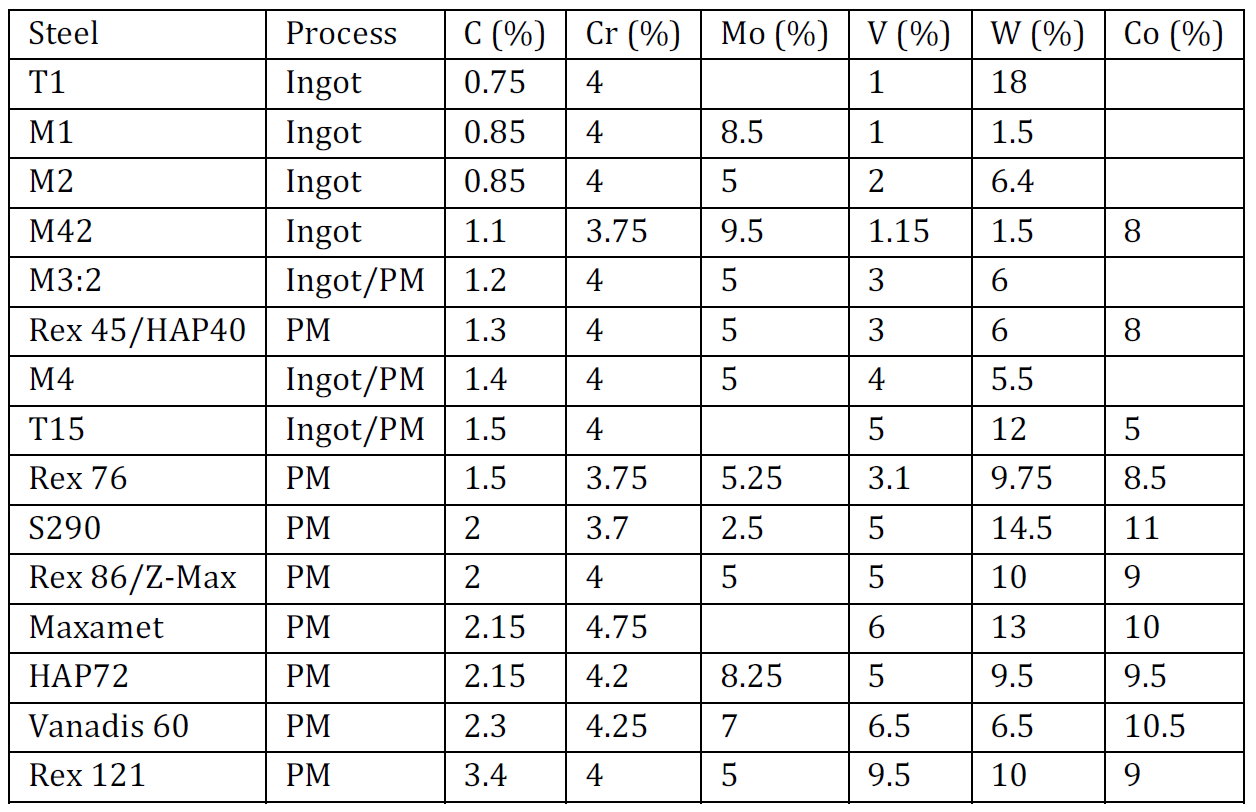
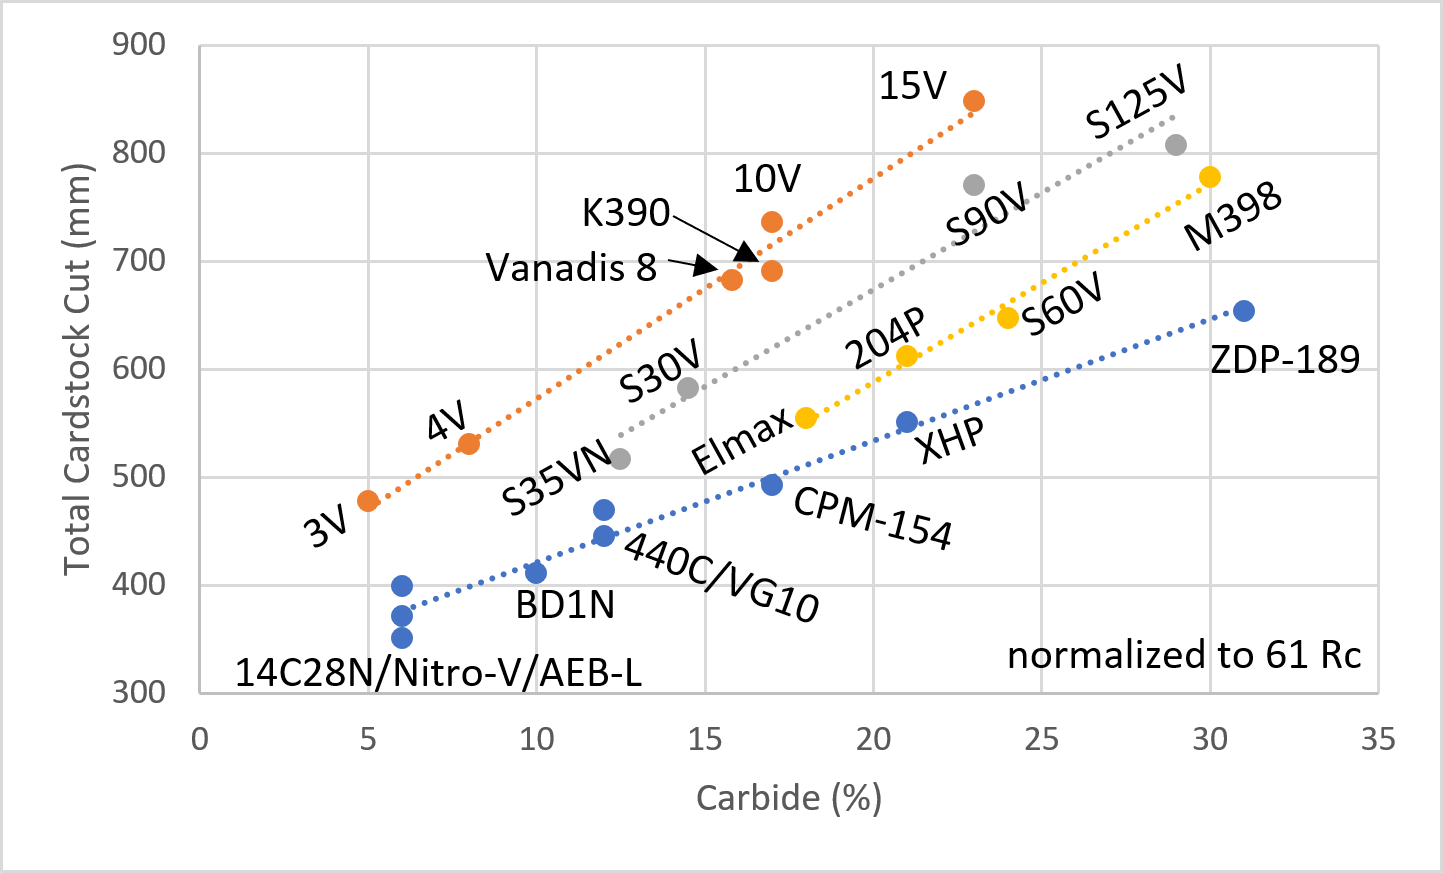
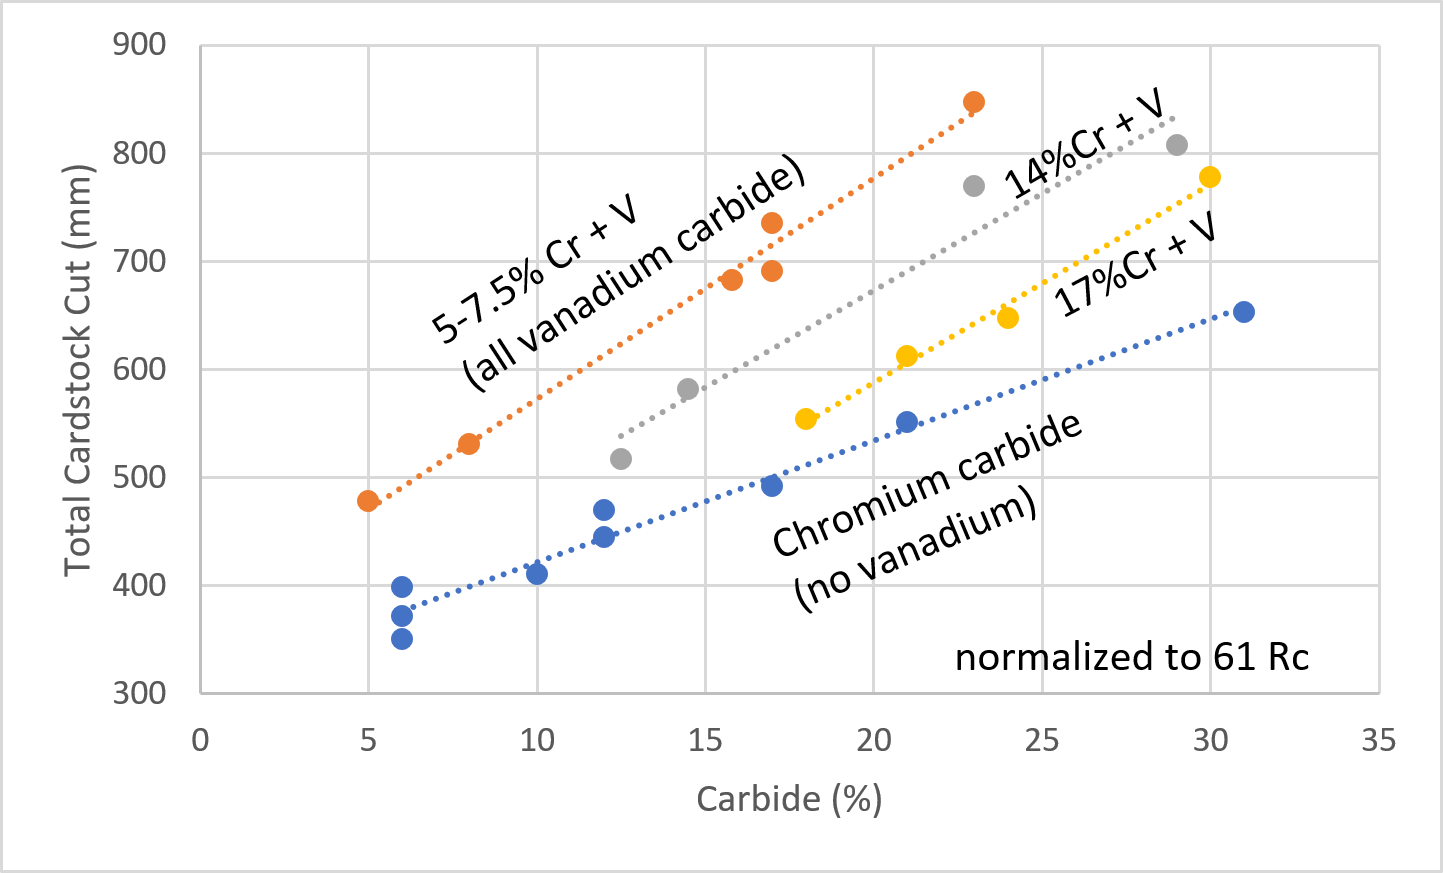
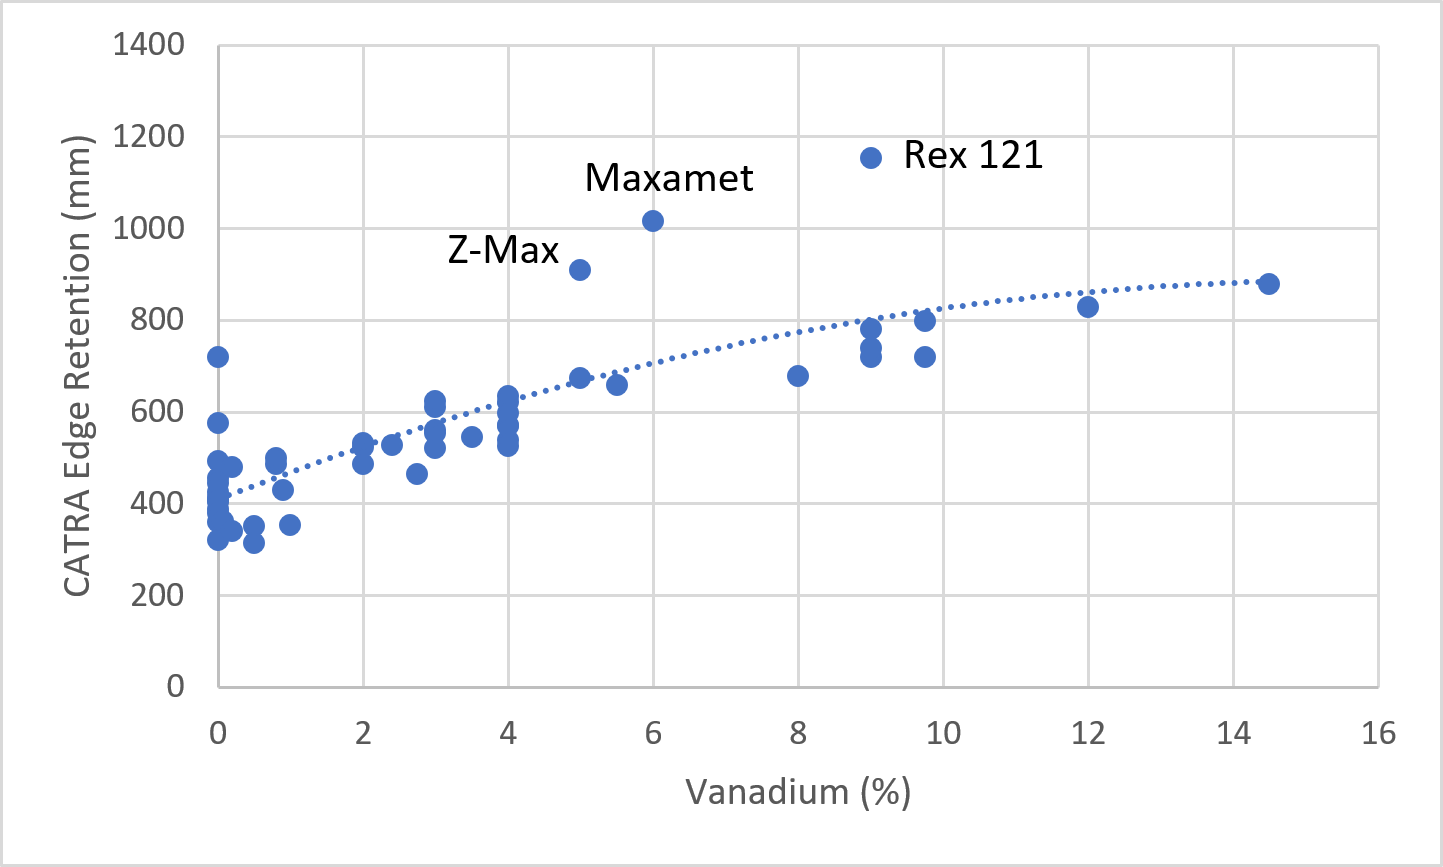
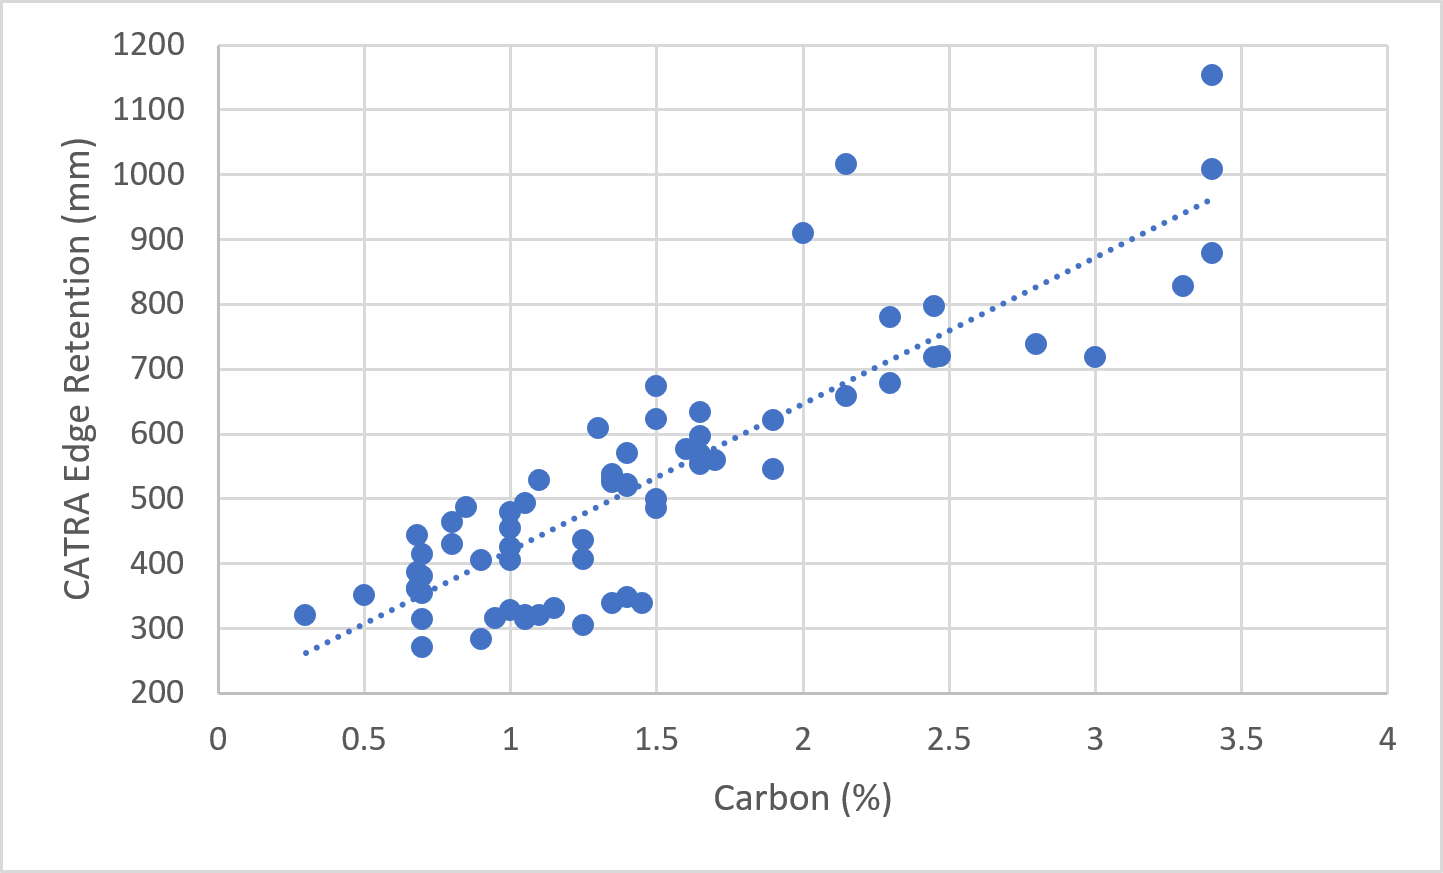
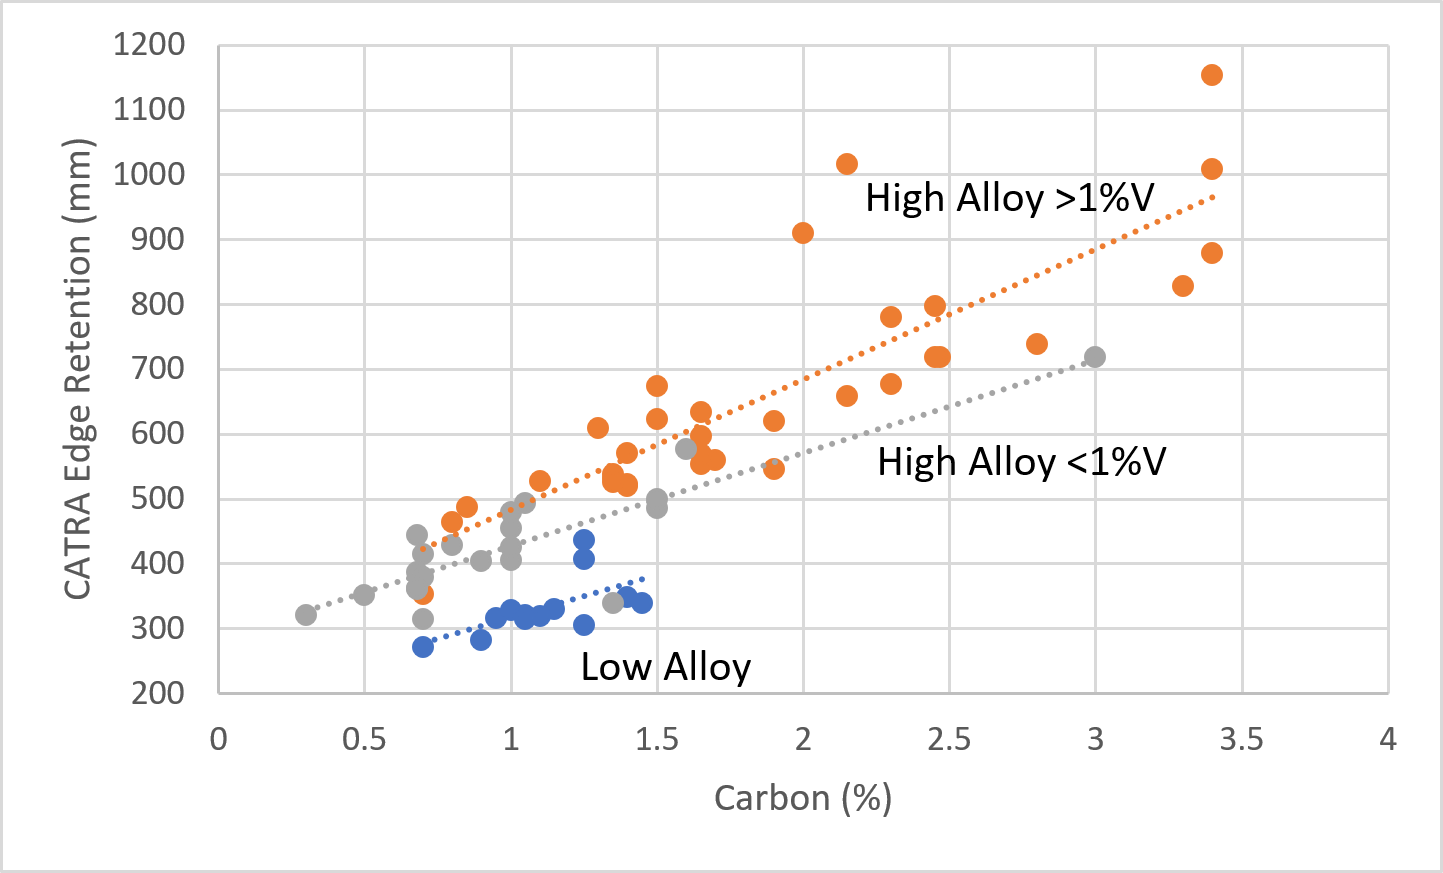
Research into CATRA results—measured in millimeters of silica-infused paper cut—shows a nearly linear correlation between carbon content and wear resistance within specific alloy groups. Carbon is the primary driver of both matrix hardness and carbide formation. However, not all carbides are created equal. Vanadium carbides are significantly harder than chromium or iron carbides (cementite). Consequently, steels with high vanadium content, such as CPM-10V or CPM-15V, exhibit extreme edge retention even when compared to other steels with similar carbon levels.
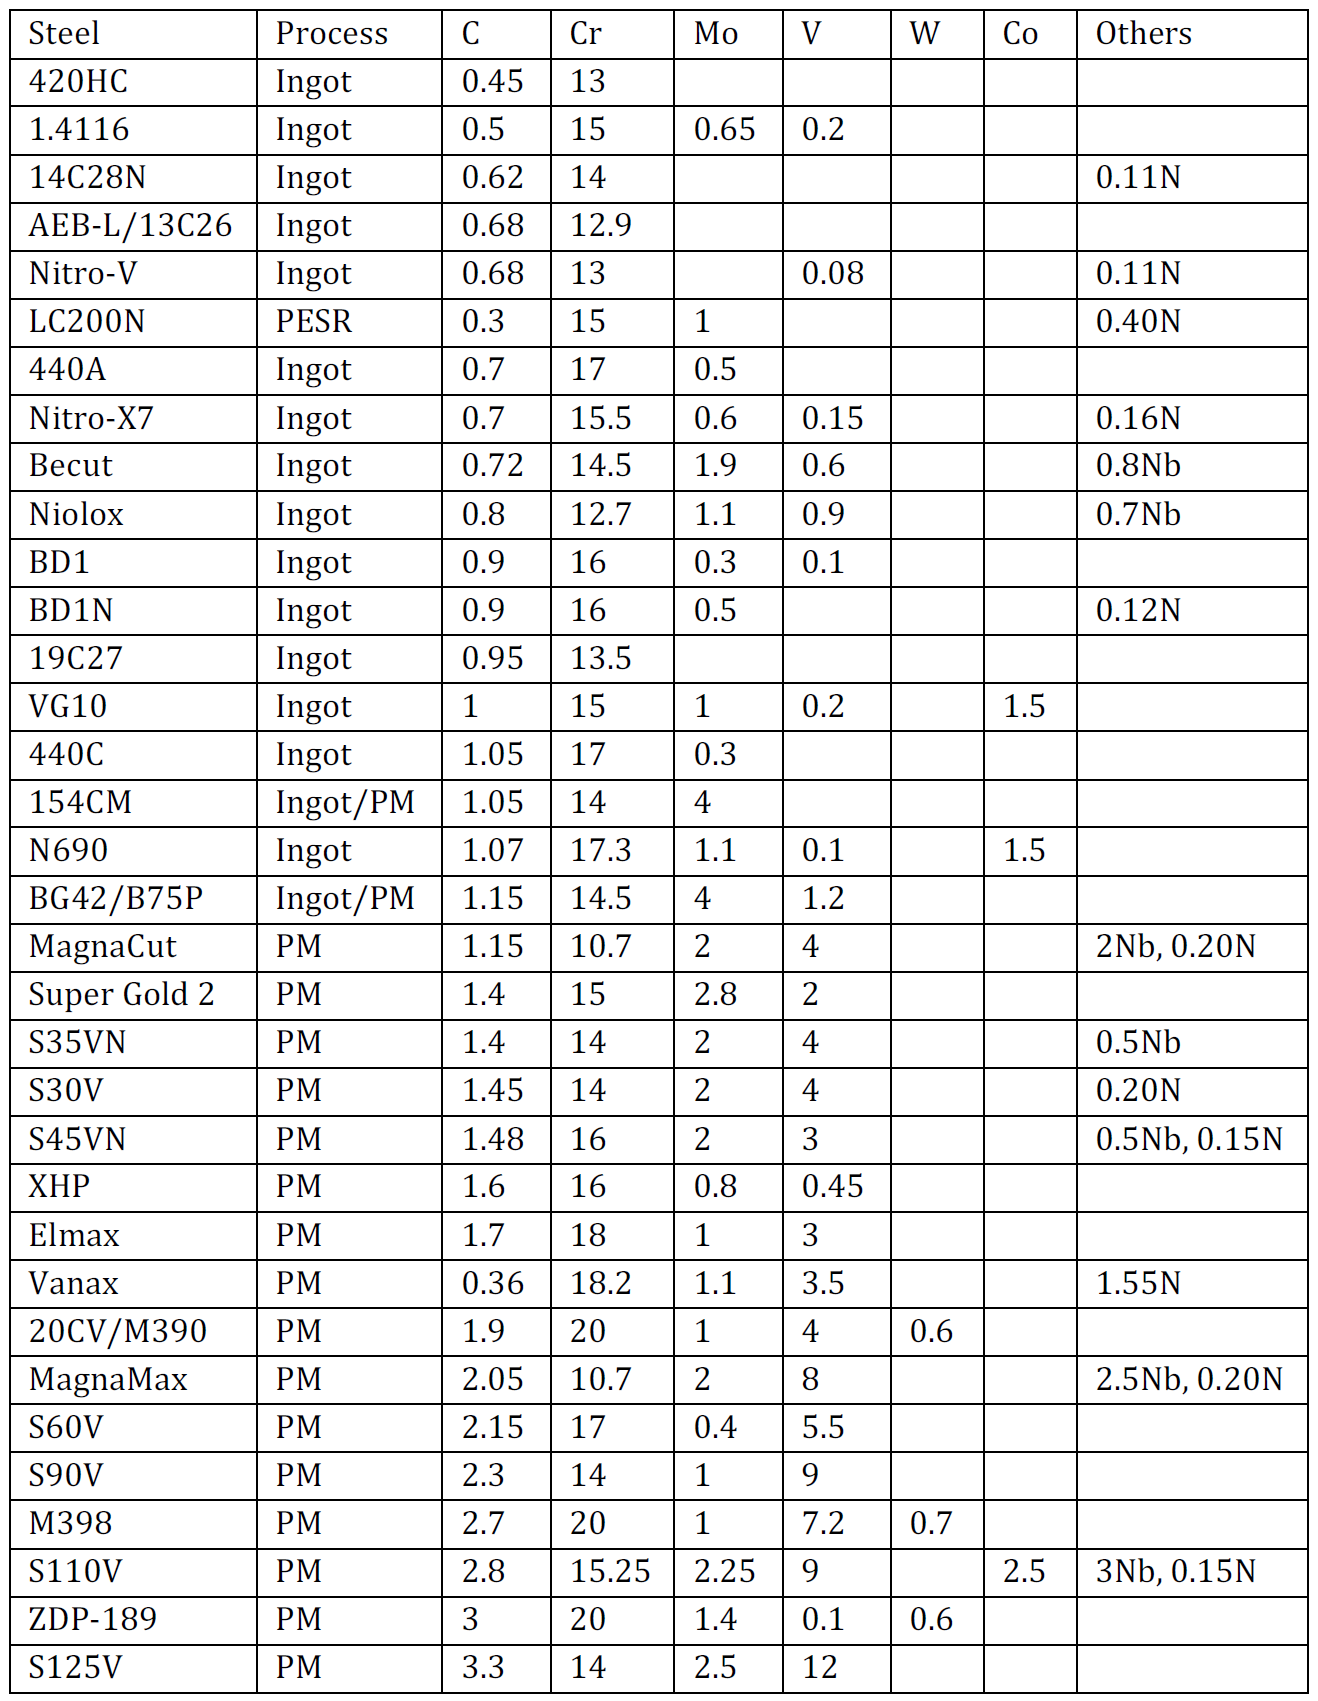
For a simplified estimation, analysts categorize steels into three tiers:
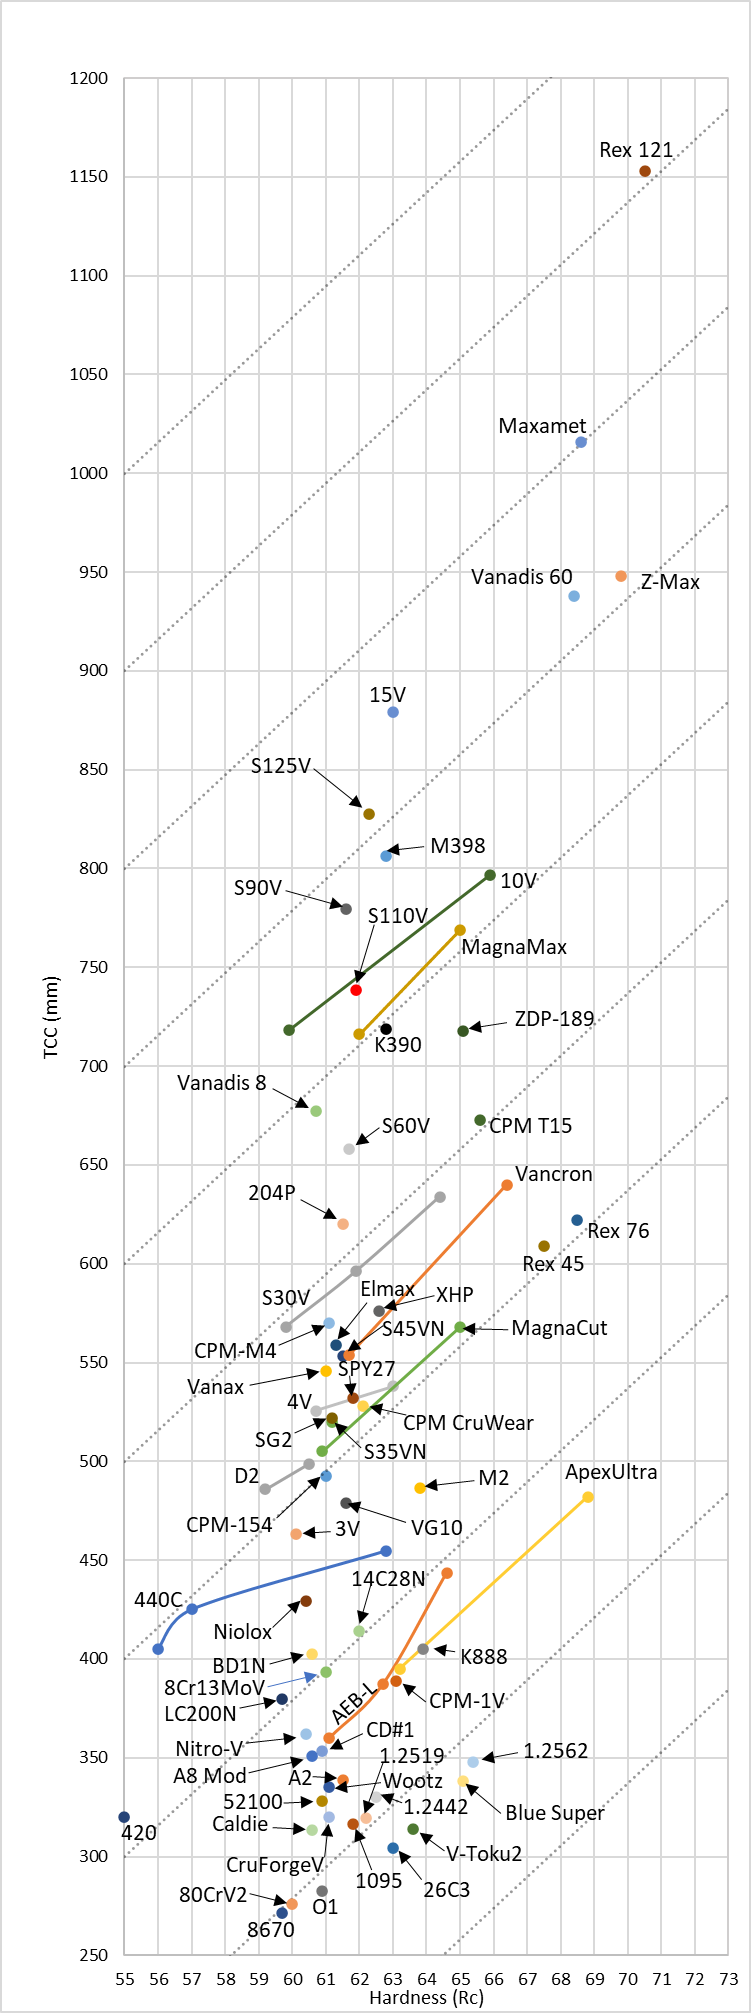
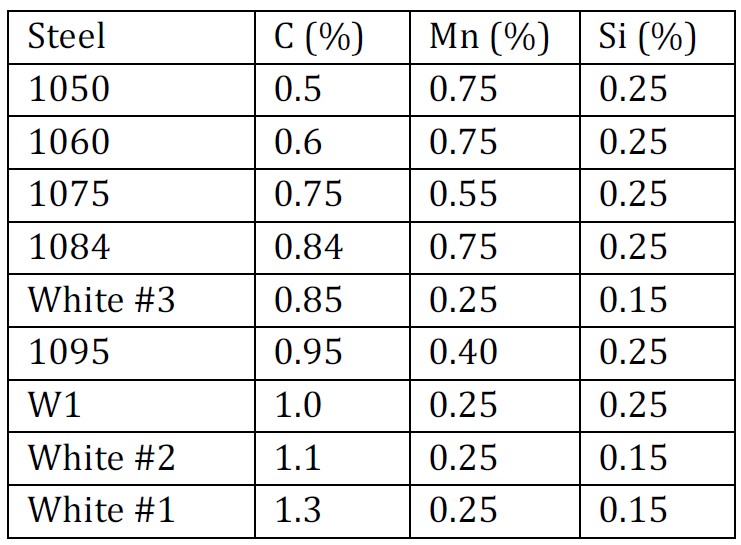
- Low Alloy Steels: These contain mostly iron carbides (cementite), which are relatively soft. Steels like 1095 or 52100 fall into this category, providing modest edge retention.
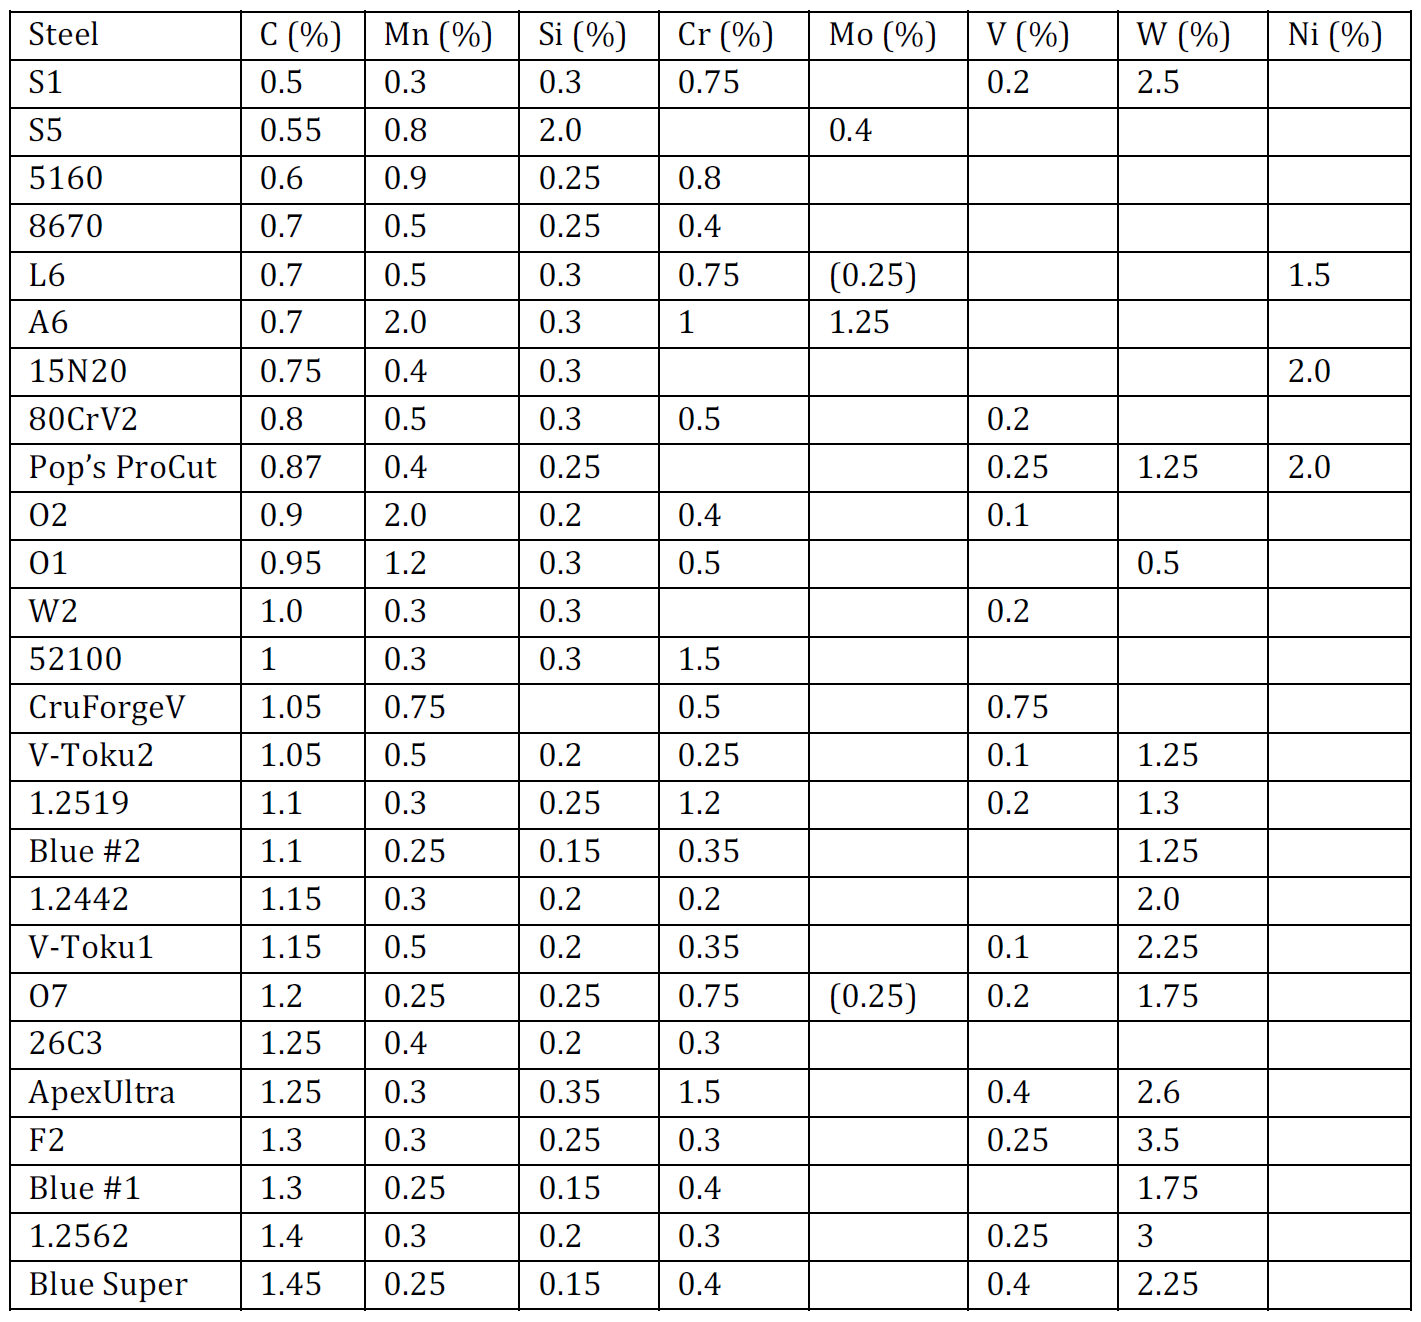
- High Alloy Non-Stainless Steels: These include tool steels with significant additions of vanadium or tungsten. The presence of these hard carbides significantly boosts wear resistance.
- High Alloy Stainless Steels: These contain high chromium (typically over 12%) and varying amounts of vanadium. While chromium carbides are softer than vanadium carbides, the sheer volume of carbide in these steels often results in high CATRA scores.
By plotting carbon content against known CATRA results, researchers have found that for every 0.1% increase in carbon, edge retention typically increases by a predictable margin, provided the alloying elements remain constant.
The Toughness Trade-off and Manufacturing Technology
Toughness, defined as a material’s ability to resist chipping or breaking under impact, is generally inversely proportional to edge retention. As carbon and carbide volume increase to improve wear resistance, the steel becomes more brittle. This is because carbides act as "crack initiation sites." Larger carbides or higher volumes of carbide make it easier for a fracture to propagate through the blade.
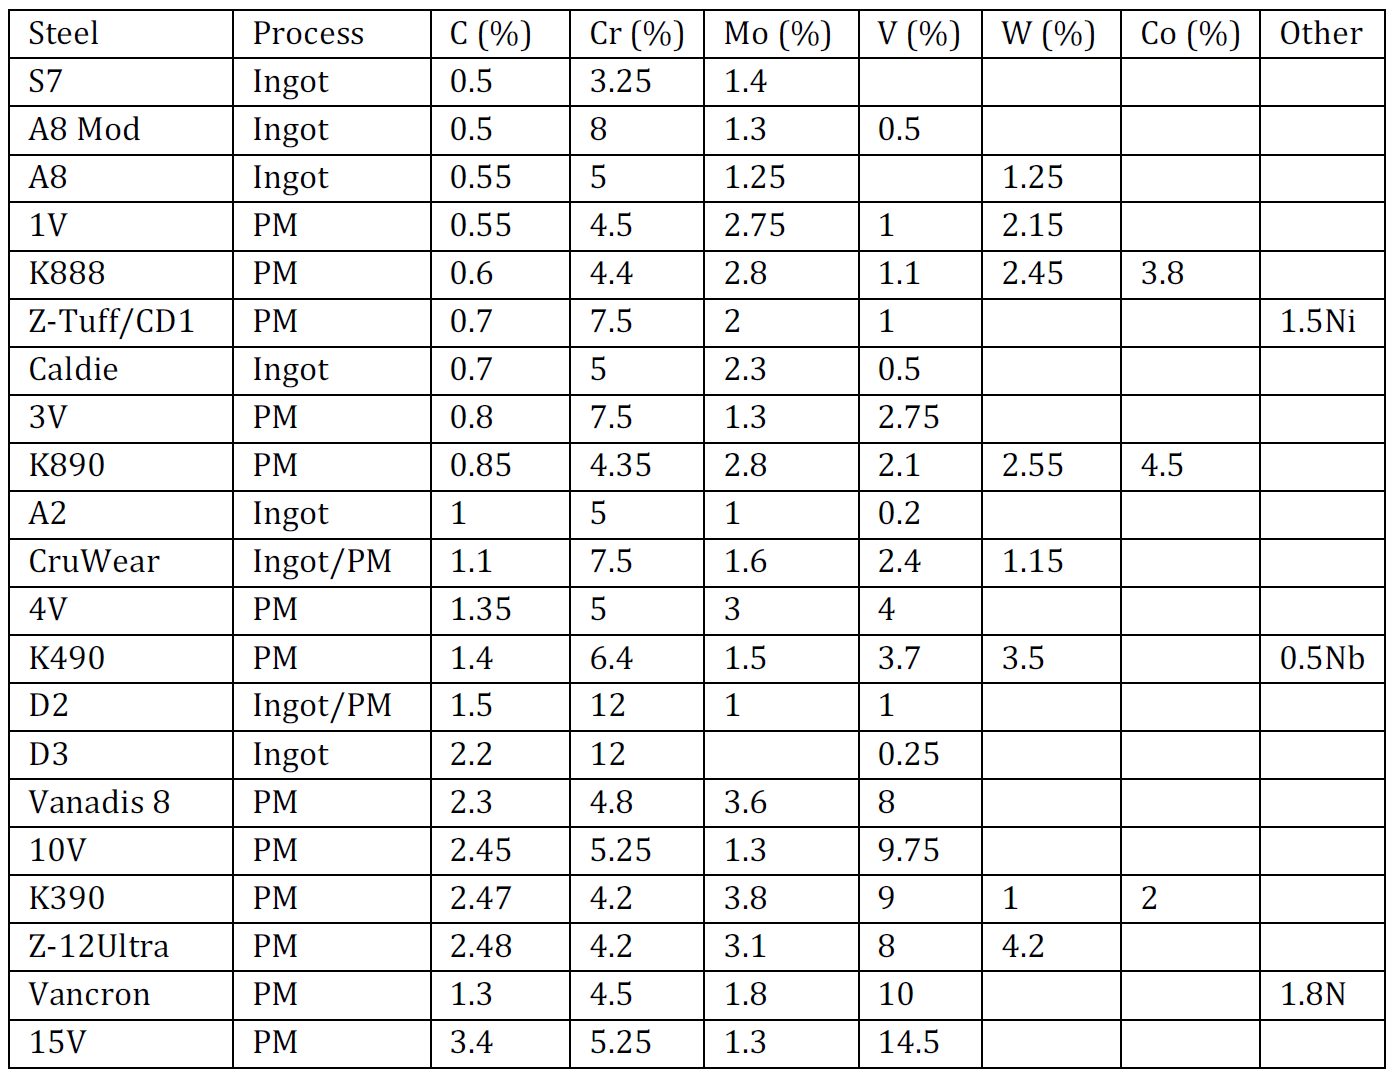
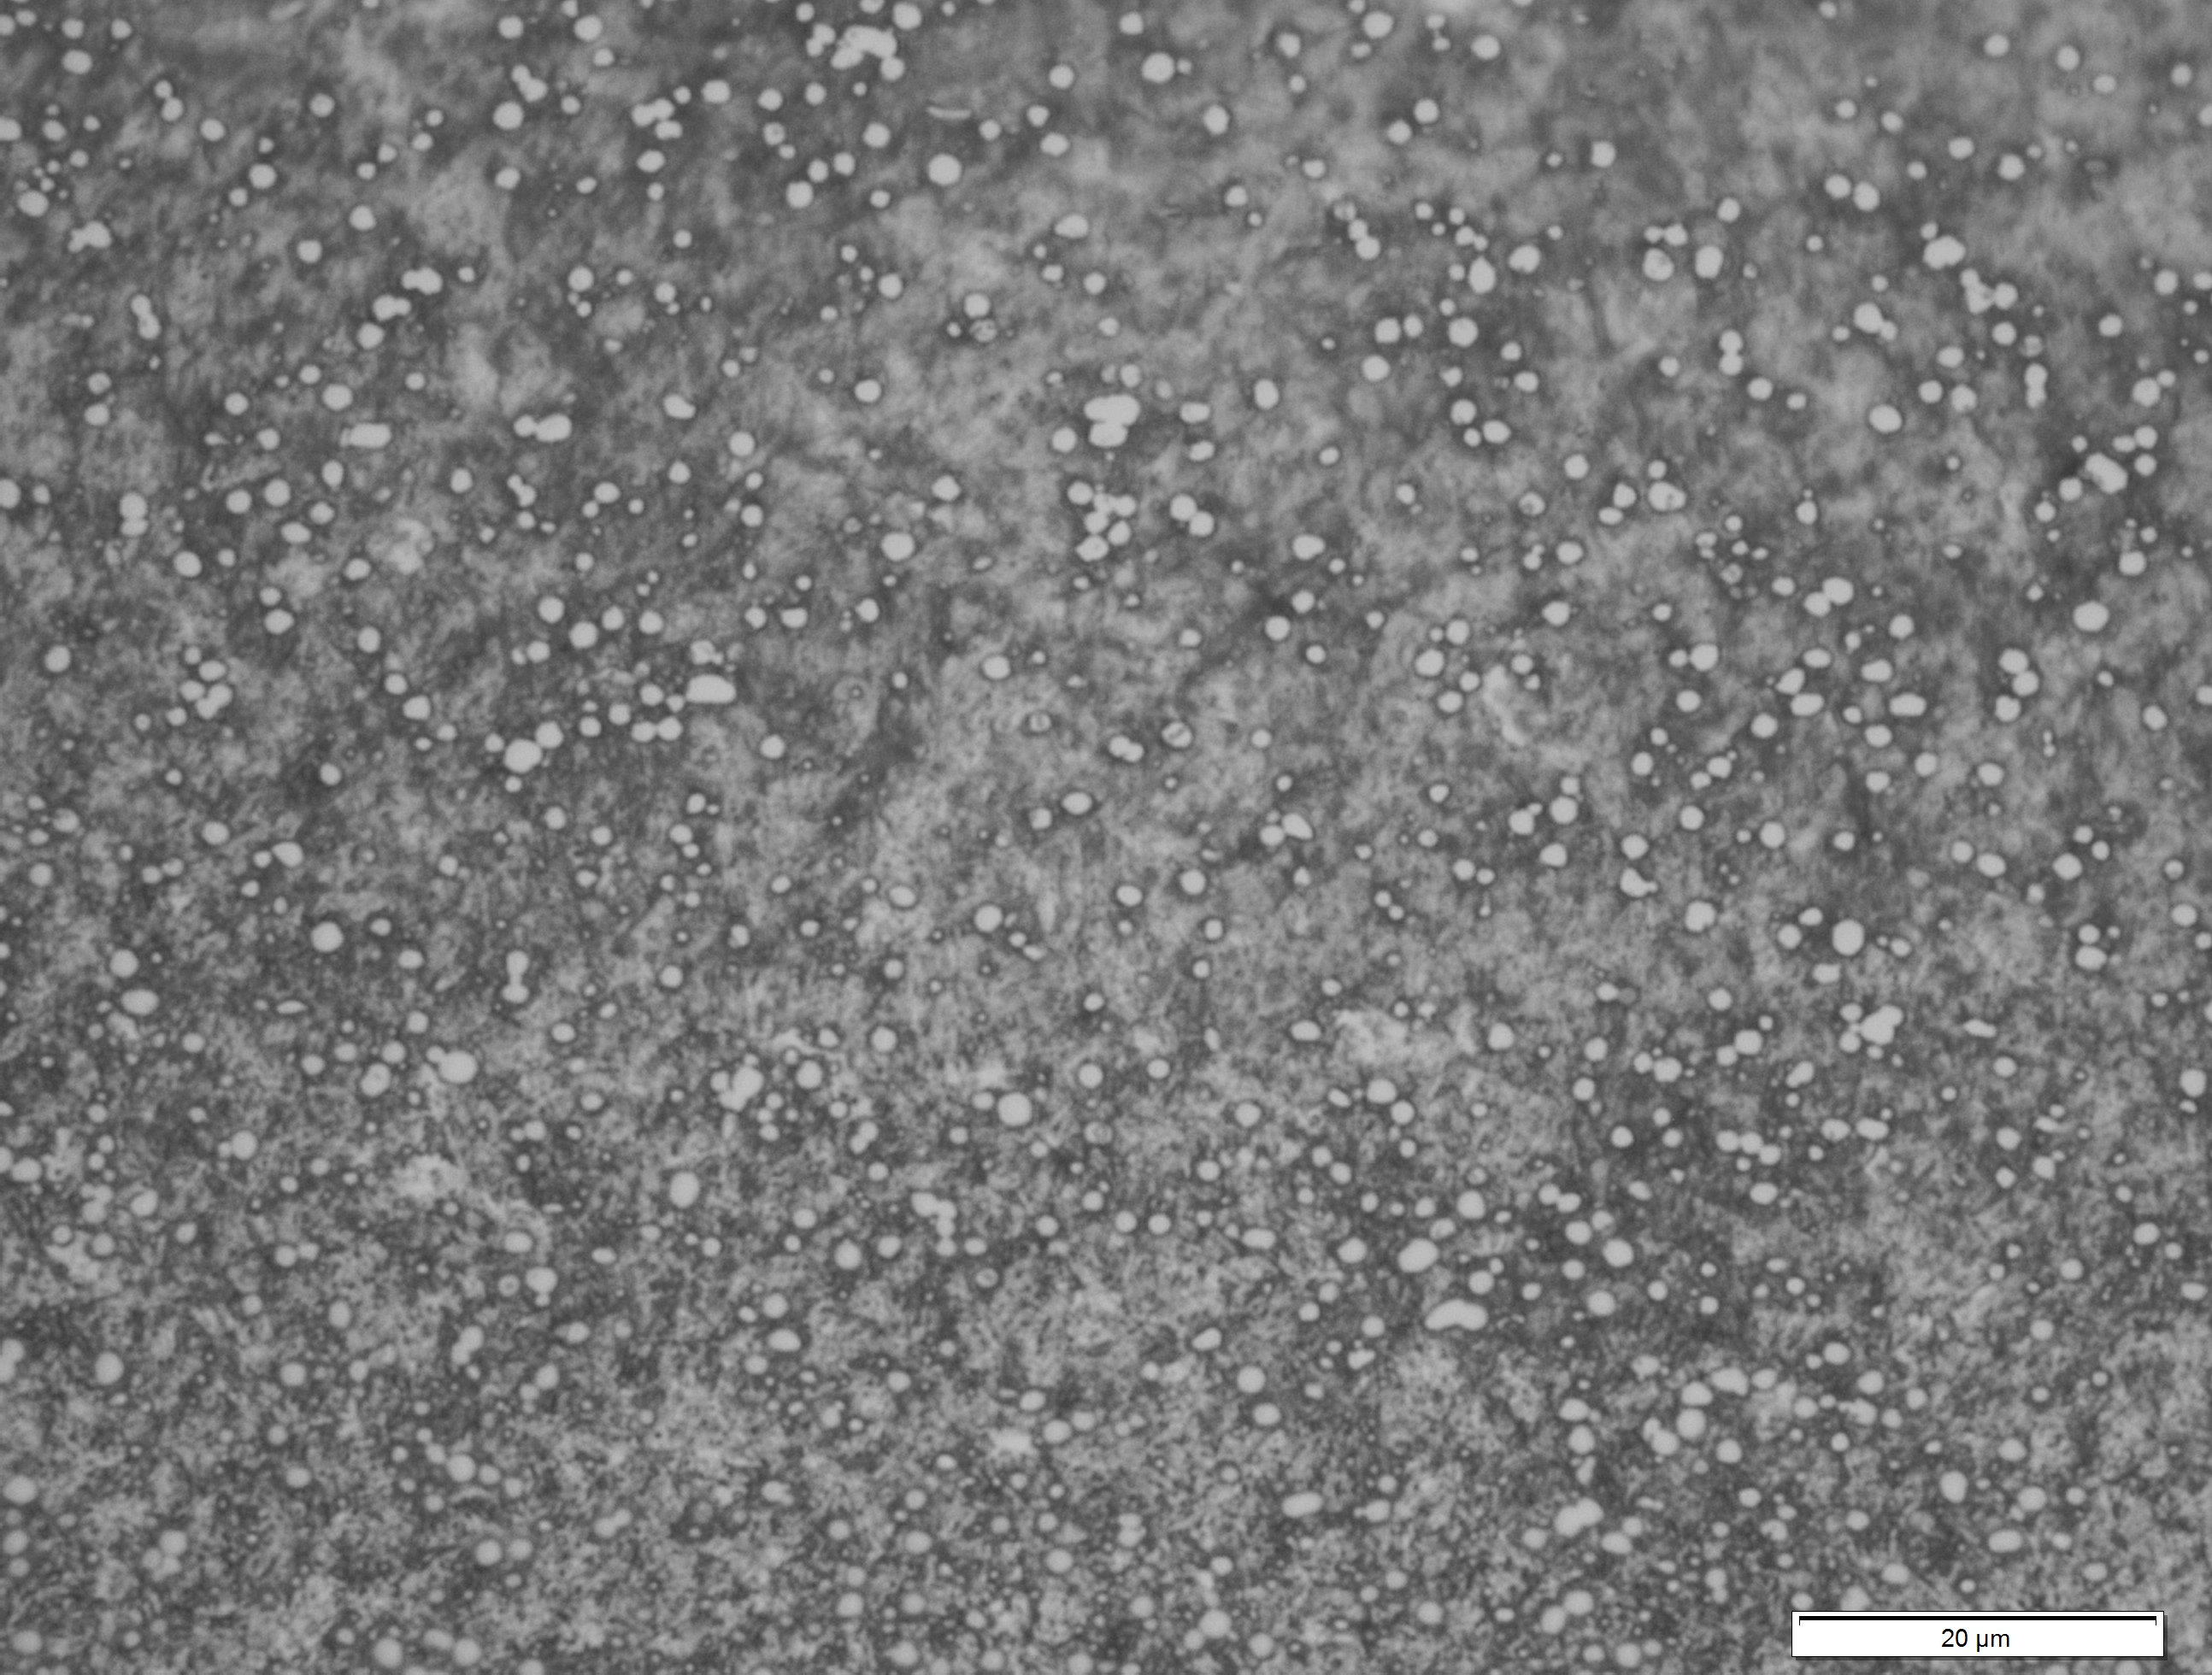
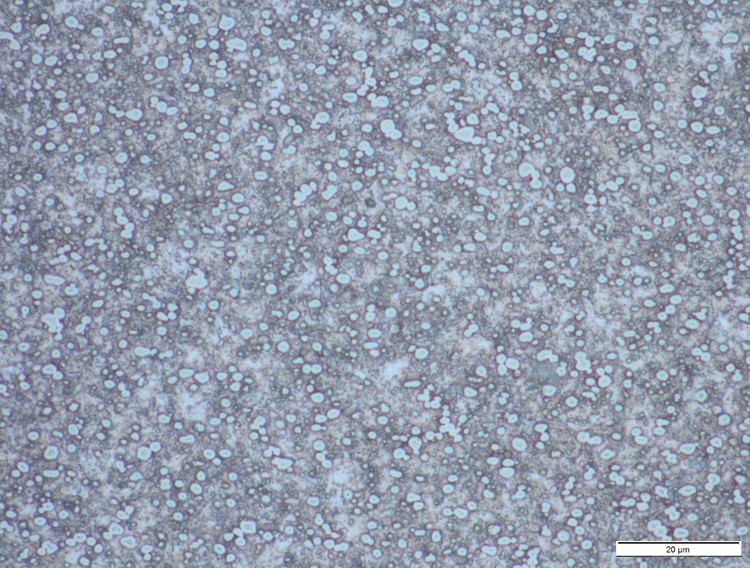
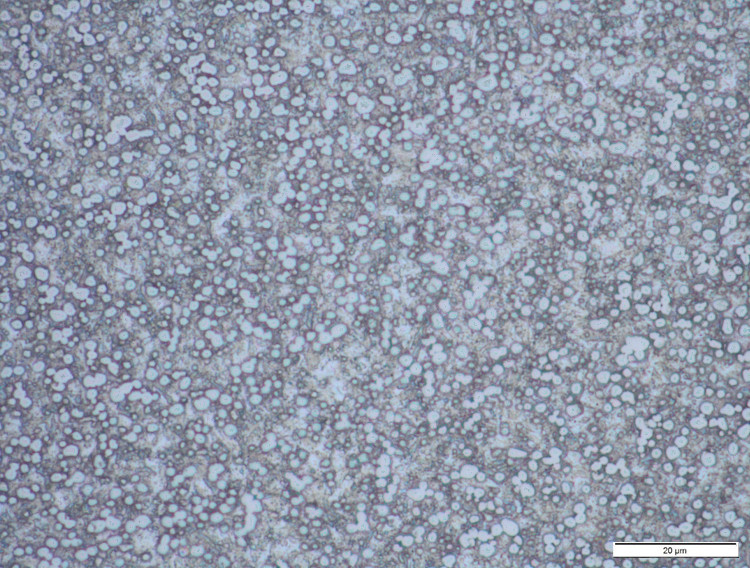
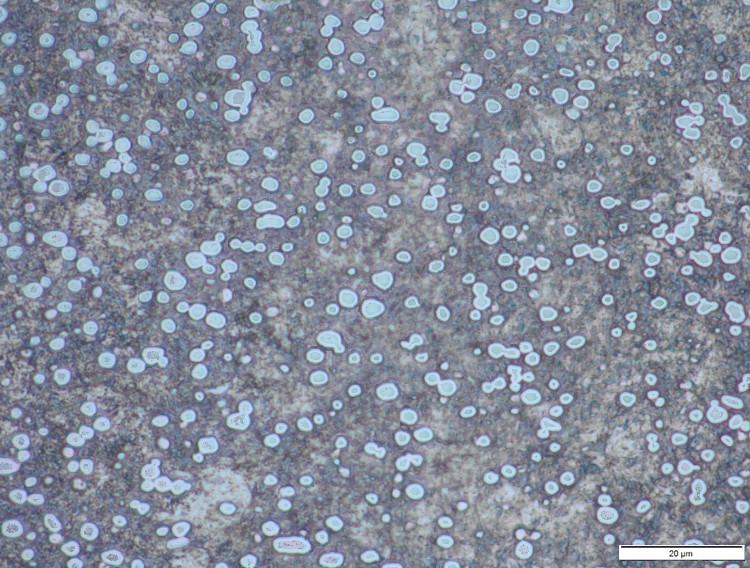
A critical factor in the toughness equation is the manufacturing method: conventional ingot casting versus powder metallurgy (PM). In conventional steelmaking, molten steel is poured into large ingots, which cool slowly. This slow cooling allows large, uneven carbide clusters to form, which can severely compromise toughness. In contrast, the powder metallurgy process involves atomizing molten steel into tiny droplets that solidify instantly, "freezing" the carbides in a fine, uniform distribution.
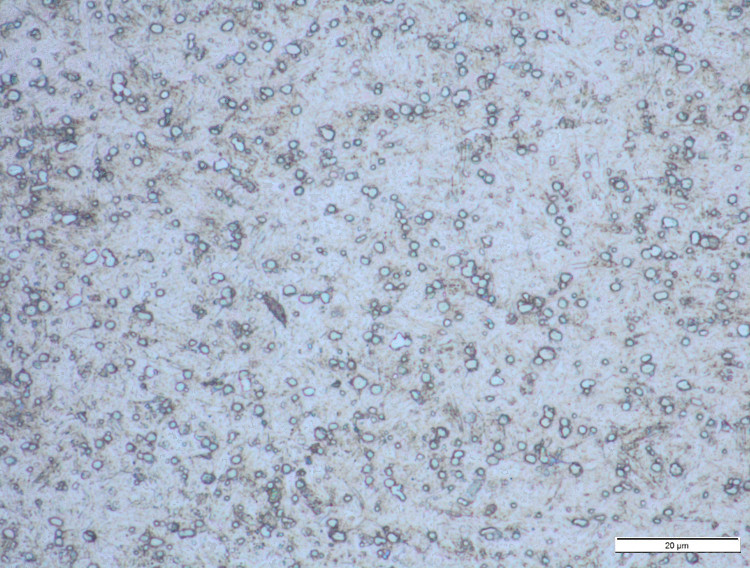
Supporting data suggests that a PM version of a steel (such as CPM-D2) can exhibit significantly higher toughness than its conventionally cast counterpart (Standard D2), despite having the exact same chemical composition. For enthusiasts estimating properties, the rule of thumb is that any steel with more than 1% carbon will see a drastic reduction in toughness unless it is produced via powder metallurgy. Furthermore, high-speed steels (designed for heat resistance) and stainless steels generally possess lower toughness than non-stainless tool steels due to their higher total carbide volume and the presence of larger chromium or tungsten carbides.
Quantifying Corrosion Resistance via the Chromium-to-Carbon Ratio
Corrosion resistance in steel is provided by "chromium in solution." For a steel to be considered stainless, it generally requires a minimum of 10.5% to 12% free chromium to form a protective chromium oxide layer on the surface. However, the bulk chromium percentage listed on a data sheet can be misleading.
Carbon has a high affinity for chromium. When steel is heat-treated, carbon "grabs" chromium to form chromium carbides. Any chromium locked in a carbide is unavailable to fight rust. This explains why a steel like D2, which has 12% chromium, is not considered stainless; its high carbon content (1.5%) ties up so much chromium that the remaining "free" chromium in the matrix is insufficient for passivity.
To estimate corrosion resistance more accurately, metallurgists look at the Chromium-to-Carbon (Cr/C) ratio. A ratio of 7:1 or higher is typically required for a steel to behave as a true stainless steel. Recent innovations like CPM-MagnaCut have revolutionized this balance by precisely balancing chromium, carbon, and vanadium so that all carbon is tied up in vanadium carbides, leaving 100% of the chromium in solution. This results in a steel that achieves "super-stainless" levels of corrosion resistance with only 10.7% bulk chromium, outperforming steels with much higher chromium levels like 440C or high-carbon stainless grades.
Chronology of Steel Development and the Rise of Specialized Grades
The history of knife steel can be viewed as a series of attempts to break the traditional "Iron Triangle" of trade-offs between toughness, edge retention, and corrosion resistance.
- Pre-1960s: Dominance of simple carbon steels (1095) and low-alloy tool steels (L6, O1). These offered high toughness and ease of sharpening but poor corrosion resistance and edge retention.
- 1970s-1980s: The "Stainless Revolution." Grades like 440C and 154CM became popular, offering rust resistance but often at the cost of toughness and sharpening difficulty.
- 1990s: The introduction of Powder Metallurgy (PM) steels to the cutlery world, led by grades like CPM-S30V. This allowed for higher alloy contents without the brittleness associated with large carbides.
- 2010s-Present: The era of "Designer Steels." Metallurgists began using advanced thermodynamic modeling to create steels specifically for knives rather than industrial repurposing. This led to the creation of Vanax, LC200N, and MagnaCut.
Broader Implications for the Cutlery Industry and Tooling
The ability to estimate steel properties from composition has profound implications for both manufacturers and consumers. For manufacturers, it reduces the need for "trial and error" in the R&D phase. By understanding the Cr/C ratio and carbide volume, engineers can predict how a new alloy will respond to specific heat treatment protocols.
For the consumer, this scientific literacy acts as a safeguard against deceptive marketing. When a new "wonder steel" is announced, an informed enthusiast can look at the elemental breakdown—noting, for example, a 2% carbon content and a lack of powder metallurgy processing—and correctly deduce that the steel will be highly wear-resistant but extremely prone to chipping.
In summary, while metallurgy remains a field of nearly infinite variables, the performance of knife steel is not a mystery. The interplay between carbon-driven hardness, vanadium-driven wear resistance, and the refining effects of powder metallurgy creates a predictable landscape. By focusing on the chemical composition and the manufacturing process, stakeholders in the knife industry can make more informed decisions, leading to better tools and a more transparent marketplace. Despite the occasional outlier or processing error, the numbers on the data sheet provide a reliable map for the steel’s journey from the forge to the pocket.