
The United States is hurtling toward a historic milestone in its energy transition, with renewable energy sources poised to outpace natural gas in total generating capacity by the summer of 2027. According to comprehensive new data from the US Energy Information Administration (EIA) analyzed by the energy advocacy group SUN DAY Campaign, renewables are expanding at a record-breaking pace that far outstrips the growth of fossil fuels and nuclear power combined.
Over the coming year, renewables’ share of total US generating capacity is projected to surge from 37.7% to 40.4%. This dramatic upward trajectory places clean energy generation—encompassing solar, wind, hydropower, biomass, and geothermal—far ahead of traditional power sources. By mid-2027, renewable capacity will outstrip nuclear infrastructure fivefold, signaling a profound structural shift in how the nation powers its homes, businesses, and industrial corridors.
Unprecedented Growth in Renewable Generation and Capacity
The EIA’s latest Electric Power Monthly report, featuring operational data through August 31, 2026, highlights the compounding momentum of clean energy technologies. During the first eight months of 2026, renewable electricity generation climbed 10.2% compared to the same period in the previous year.
Utility-scale solar (>1 MW) spearheaded this expansion, registering a remarkable 20.0% increase in output. Small-scale distributed solar followed closely with a 12.0% jump, while wind power generation grew by 7.8%. Hydropower and geothermal energy also saw modest gains, rising 4.2% and 3.8%, respectively.
To put these figures into perspective, wind energy produced 333,367 gigawatt-hours (GWh) between January and August 2026, capturing 10.6% of total US electrical generation. Combined utility-scale and small-scale solar output reached 329,119 GWh, accounting for 10.5% of the national total. Hydropower added 180,940 GWh (5.7%), biomass contributed 29,917 GWh (1.0%), and geothermal energy generated 10,766 GWh (0.34%).
In stark contrast, conventional energy sources experienced sluggish growth or outright declines. Electricity generated by natural gas and nuclear power plants crept upward by just 2.6% and 1.3%, respectively. Meanwhile, coal-fired power generation plummeted by 8.7%, continuing a long-term structural decline driven by economic pressures and environmental regulations.
When aggregating all renewable sectors, clean energy accounted for 28.1% of total US electrical generation through the first two-thirds of 2026, up significantly from 26.2% during the corresponding timeframe in 2025. Wind and solar combined generated 44.4% more electricity than coal and 24.8% more than nuclear energy over the same eight-month window.
A Timeline of Rapid Infrastructure Expansion
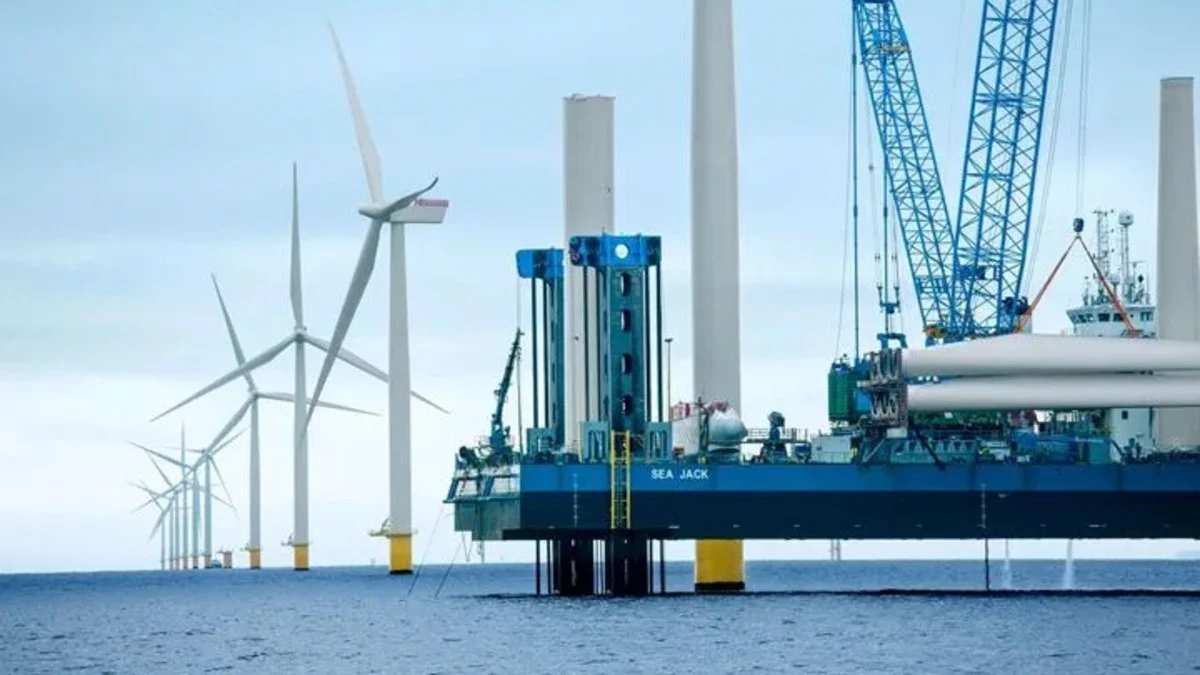
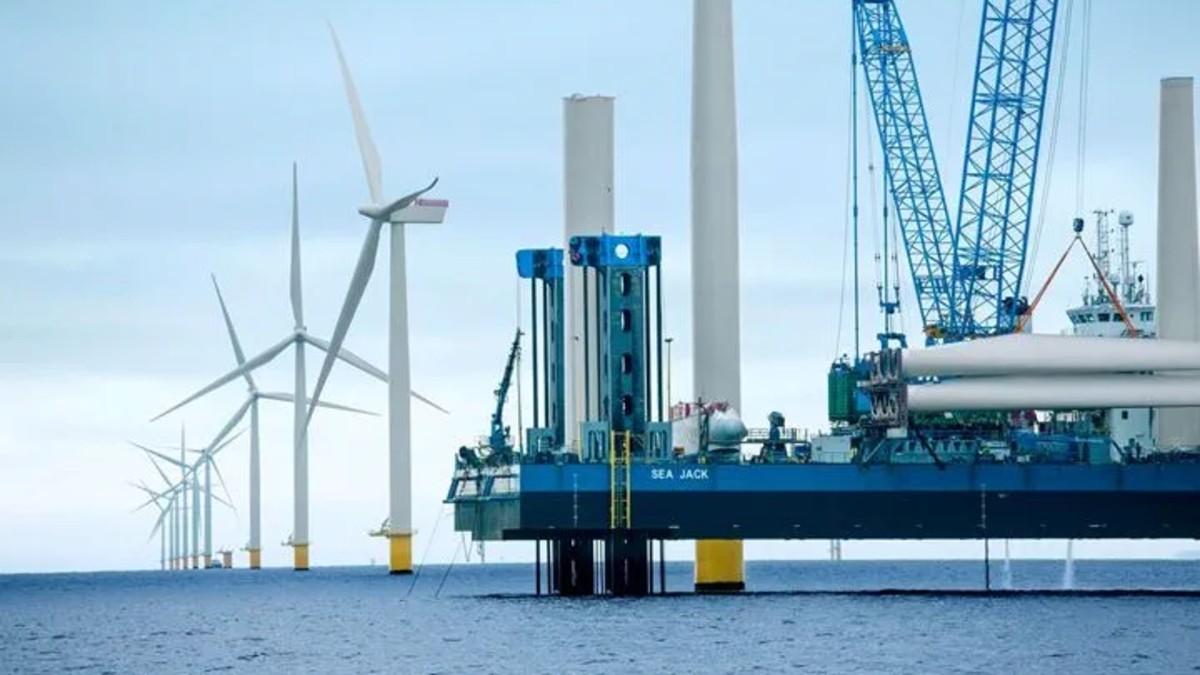
The acceleration of renewable energy is equally visible in infrastructure buildout. Between September 1, 2025, and August 31, 2026, the installed capacity of utility-scale solar expanded by a staggering 27,141.7 megawatts (MW). Small-scale solar added 6,526.1 MW, while wind capacity grew by 9,979.1 MW—a figure that includes 800 MW of newly operational offshore wind capacity. Across all renewable categories, including hydropower, biomass, and geothermal, total capacity grew by 43,497.9 MW over the 12-month span.
Concurrently, the energy storage sector experienced explosive growth. Utility-scale battery energy storage capacity increased by 17,586.9 MW, reflecting the critical industry focus on grid reliability, load balancing, and mitigating the intermittent nature of wind and solar power.
Conversely, fossil fuel and nuclear expansion remained largely stagnant. Coal capacity contracted by 2,703.4 MW as older plants were retired, and nuclear capacity held flat with zero net additions. Natural gas capacity increased by a modest 5,316.0 MW. Combined, the net new capacity additions from fossil fuels and nuclear totaled just 2,612.6 MW—meaning that renewable energy capacity growth outpaced conventional thermal and nuclear growth by a factor of nearly 17 to one.
Projections for the Coming Year: 53 GW of New Renewables
Looking ahead, federal forecasters expect the pace of deployment to accelerate even further. The EIA projects that utility-scale renewables will add over 53,000 MW (53 GW) of new capacity over the next 12 months.
As of September 1, 2026, renewable energy comprised 34.5% of total US utility-scale generating capacity. The EIA projects this figure will climb to 37.3% by August 31, 2027. Utility-scale solar is expected to lead the charge by adding 44,603.1 MW, raising its share of utility-scale capacity from 13.4% to 16.5%. Wind energy is projected to grow by an additional 8,312.3 MW—including 3,355.0 MW of offshore wind installations—pushing its share to 13.5%. Other renewable sources will contribute a combined 201.9 MW.
The projected net capacity growth of 53,117.3 MW for utility-scale renewables over the upcoming year represents a nearly 44% increase over the 36,971.8 MW added during the preceding 12-month cycle. Meanwhile, the EIA anticipates zero additions to nuclear generating capacity and a net reduction of 1,997.0 MW in fossil fuel infrastructure.

Small-Scale Solar and the Path to Overtaking Natural Gas
While utility-scale projects dominate headline figures, distributed generation plays an increasingly vital role in the American energy landscape. Small-scale solar installations grew by 6,526.1 MW over the past year, pushing total decentralized solar capacity to 63,192.6 MW.
Although the EIA does not explicitly forecast distributed solar growth for the upcoming year, baseline trends provide a reliable indicator. Over the past five years, small-scale solar has expanded at an average rate of approximately 6,400 MW annually. Assuming a conservative growth rate of 6,000 MW over the next 12 months, total US renewable energy capacity is on track to surpass 550,000 MW by September 1, 2027.
By comparison, projected natural gas generating capacity is expected to stand at approximately 518,312.8 MW. This crossover point marks a historic turning point: for the first time, aggregate renewable energy capacity will eclipse natural gas. Solar power alone will account for more than one-fifth (20.7%) of total US generating capacity.
The Crucial Role of Battery Energy Storage
The rapid integration of variable renewable sources necessitates robust grid-level storage capabilities to ensure uninterrupted power delivery. Recognizing this imperative, the energy storage sector is scaling up in tandem with generation assets.
The EIA forecasts that battery energy storage systems will expand by 23,656.2 MW by September 1, 2027, representing a massive 43.7% increase that will bring total operational storage capacity to 77,753.2 MW.
When combining utility-scale renewables and utility-scale battery storage, the US power grid will absorb nearly 76,773.5 MW of new clean energy infrastructure by late summer 2027. Factoring in distributed small-scale solar arrays, total new generation and storage capacity additions could exceed 82.8 gigawatts over the 12-month forecast period.
Industry Reactions and Broader Market Implications
Energy analysts and market observers emphasize that these figures underscore an irreversible momentum within the domestic power sector.

"Each new issue of EIA’s Electric Power Monthly reinforces the theme that the growth of solar, wind, and battery storage has become unstoppable," said Ken Bossong, Executive Director of the SUN DAY Campaign. "Meanwhile, the share of the nation’s electrical generation and generating capacity provided by fossil fuels and nuclear continues to shrink."
The economic and environmental implications of this transition are far-reaching. As capital expenditures increasingly favor zero-carbon assets over traditional fossil fuel infrastructure, utility operators, regional transmission organizations (RTOs), and independent power producers are fundamentally redesigning grid management strategies. High-capacity battery storage, advanced transmission interconnections, and software-driven load management are rapidly transforming from supplementary tools into foundational pillars of modern electrical grids.
Furthermore, state and federal policy frameworks, corporate sustainability commitments, and falling technology costs continue to act as powerful catalysts. Despite ongoing supply chain hurdles, regulatory bottlenecks, and permitting challenges in certain regions, the sheer market velocity of clean energy deployment defies macroeconomic headwinds.
As the United States marches toward its mid-2027 benchmarks, the data confirms that the transformation of the nation’s energy portfolio is not merely a theoretical policy goal, but an active, accelerating economic reality reshaping the modern industrial landscape.